
Yuchen
CEO
Previously VP of Engineering at Instacart and Principal Engineer at Google Ads
Ph.D in Machine Learning from Northwestern, B.Eng from Tsinghua
Connect your marketing data and get an independent Marketing Mix Model showing what’s working—and where your next dollar should go.
Get my measurement reportFREEYour first measurement report.
CEO
Previously VP of Engineering at Instacart and Principal Engineer at Google Ads
Ph.D in Machine Learning from Northwestern, B.Eng from Tsinghua

CTO
Previously Sr Director of Engineering at Instacart and Senior Staff Engineer at Google Ads
Ph.D in Machine Learning from UC Santa Cruz. B.Eng from Fudan

Founding Engineer
Previously Staff engineer at Instacart and Google Ads
Ph.D in Machine Learning from Indiana University Bloomington. B.Eng from SJTU

Member of Technical Staff
Previously Director of Engineering at Instacart and Staff Engineer at Google
Ph.D in Statistics from Duke University. Bachelor in Math from Peking University.

Data Scientist
Previously Member of Research Staff at The Voleon Group
Ph.D. Princeton University
B.Eng. Tsinghua University.

Data Scientist
Previous Head of Data Science at TikTok, leading user growth and marketing measurement.
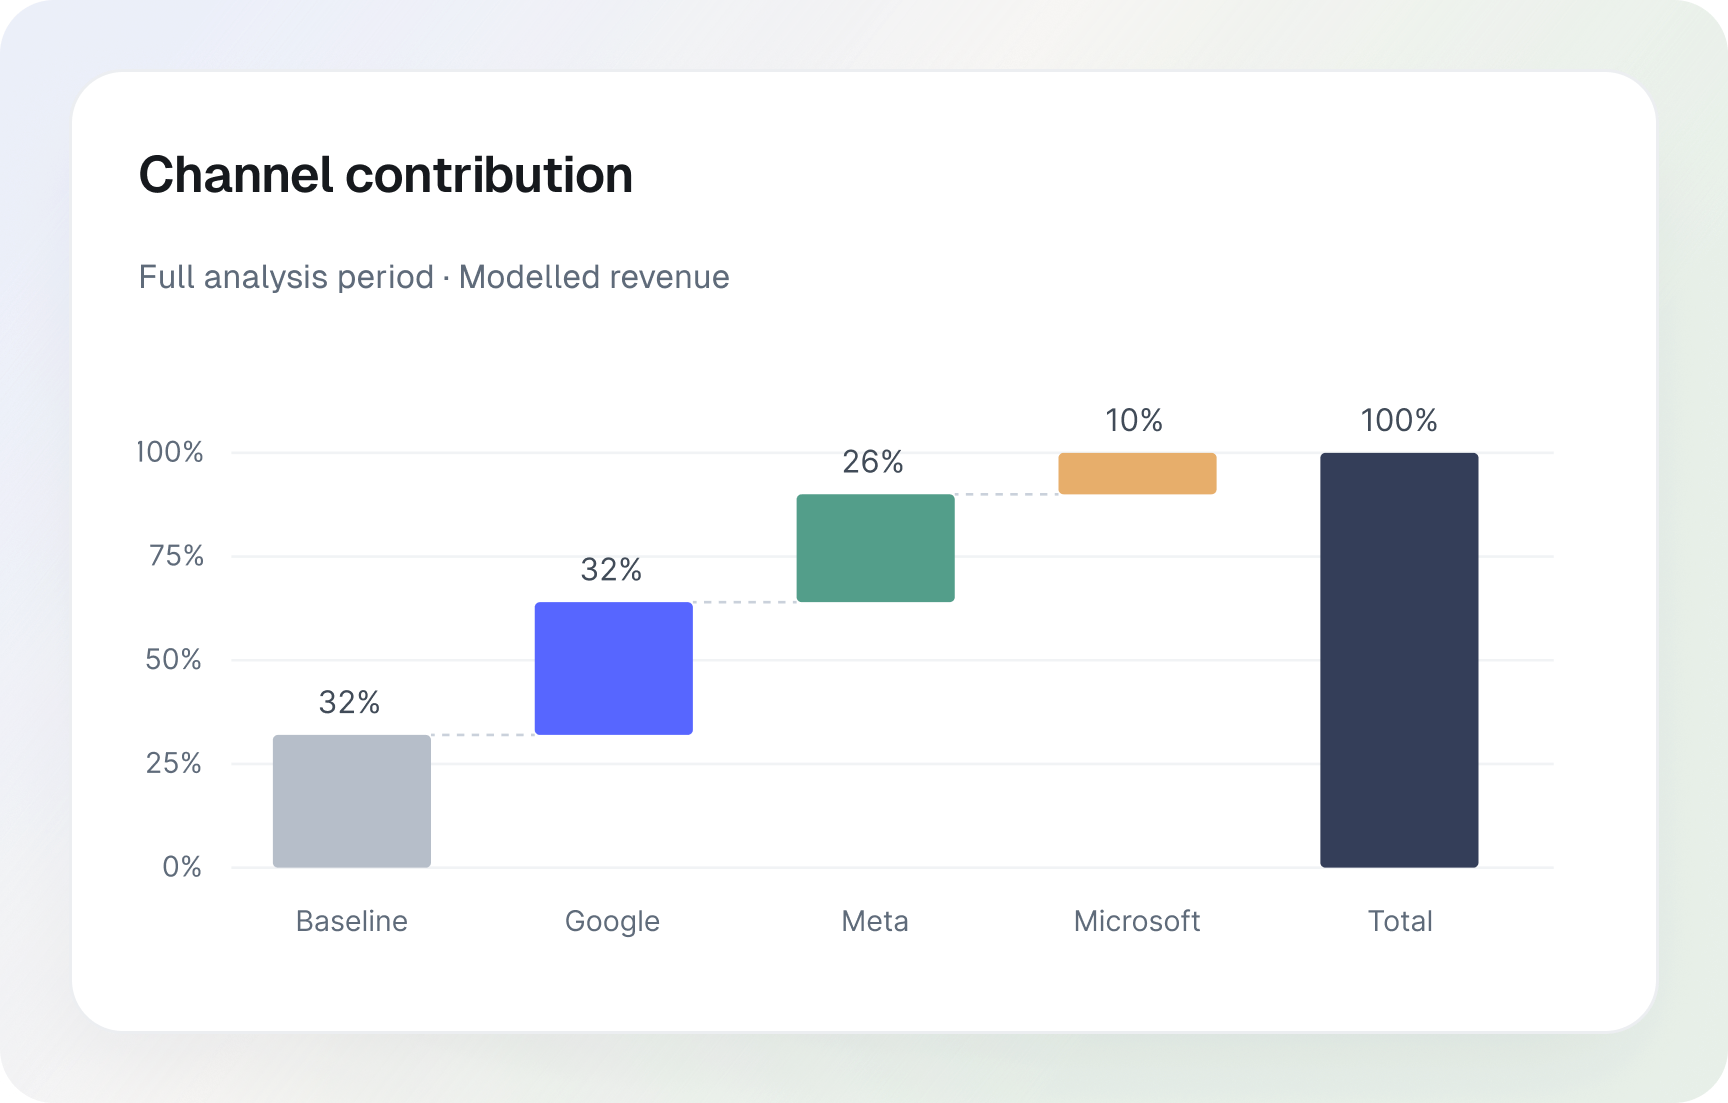
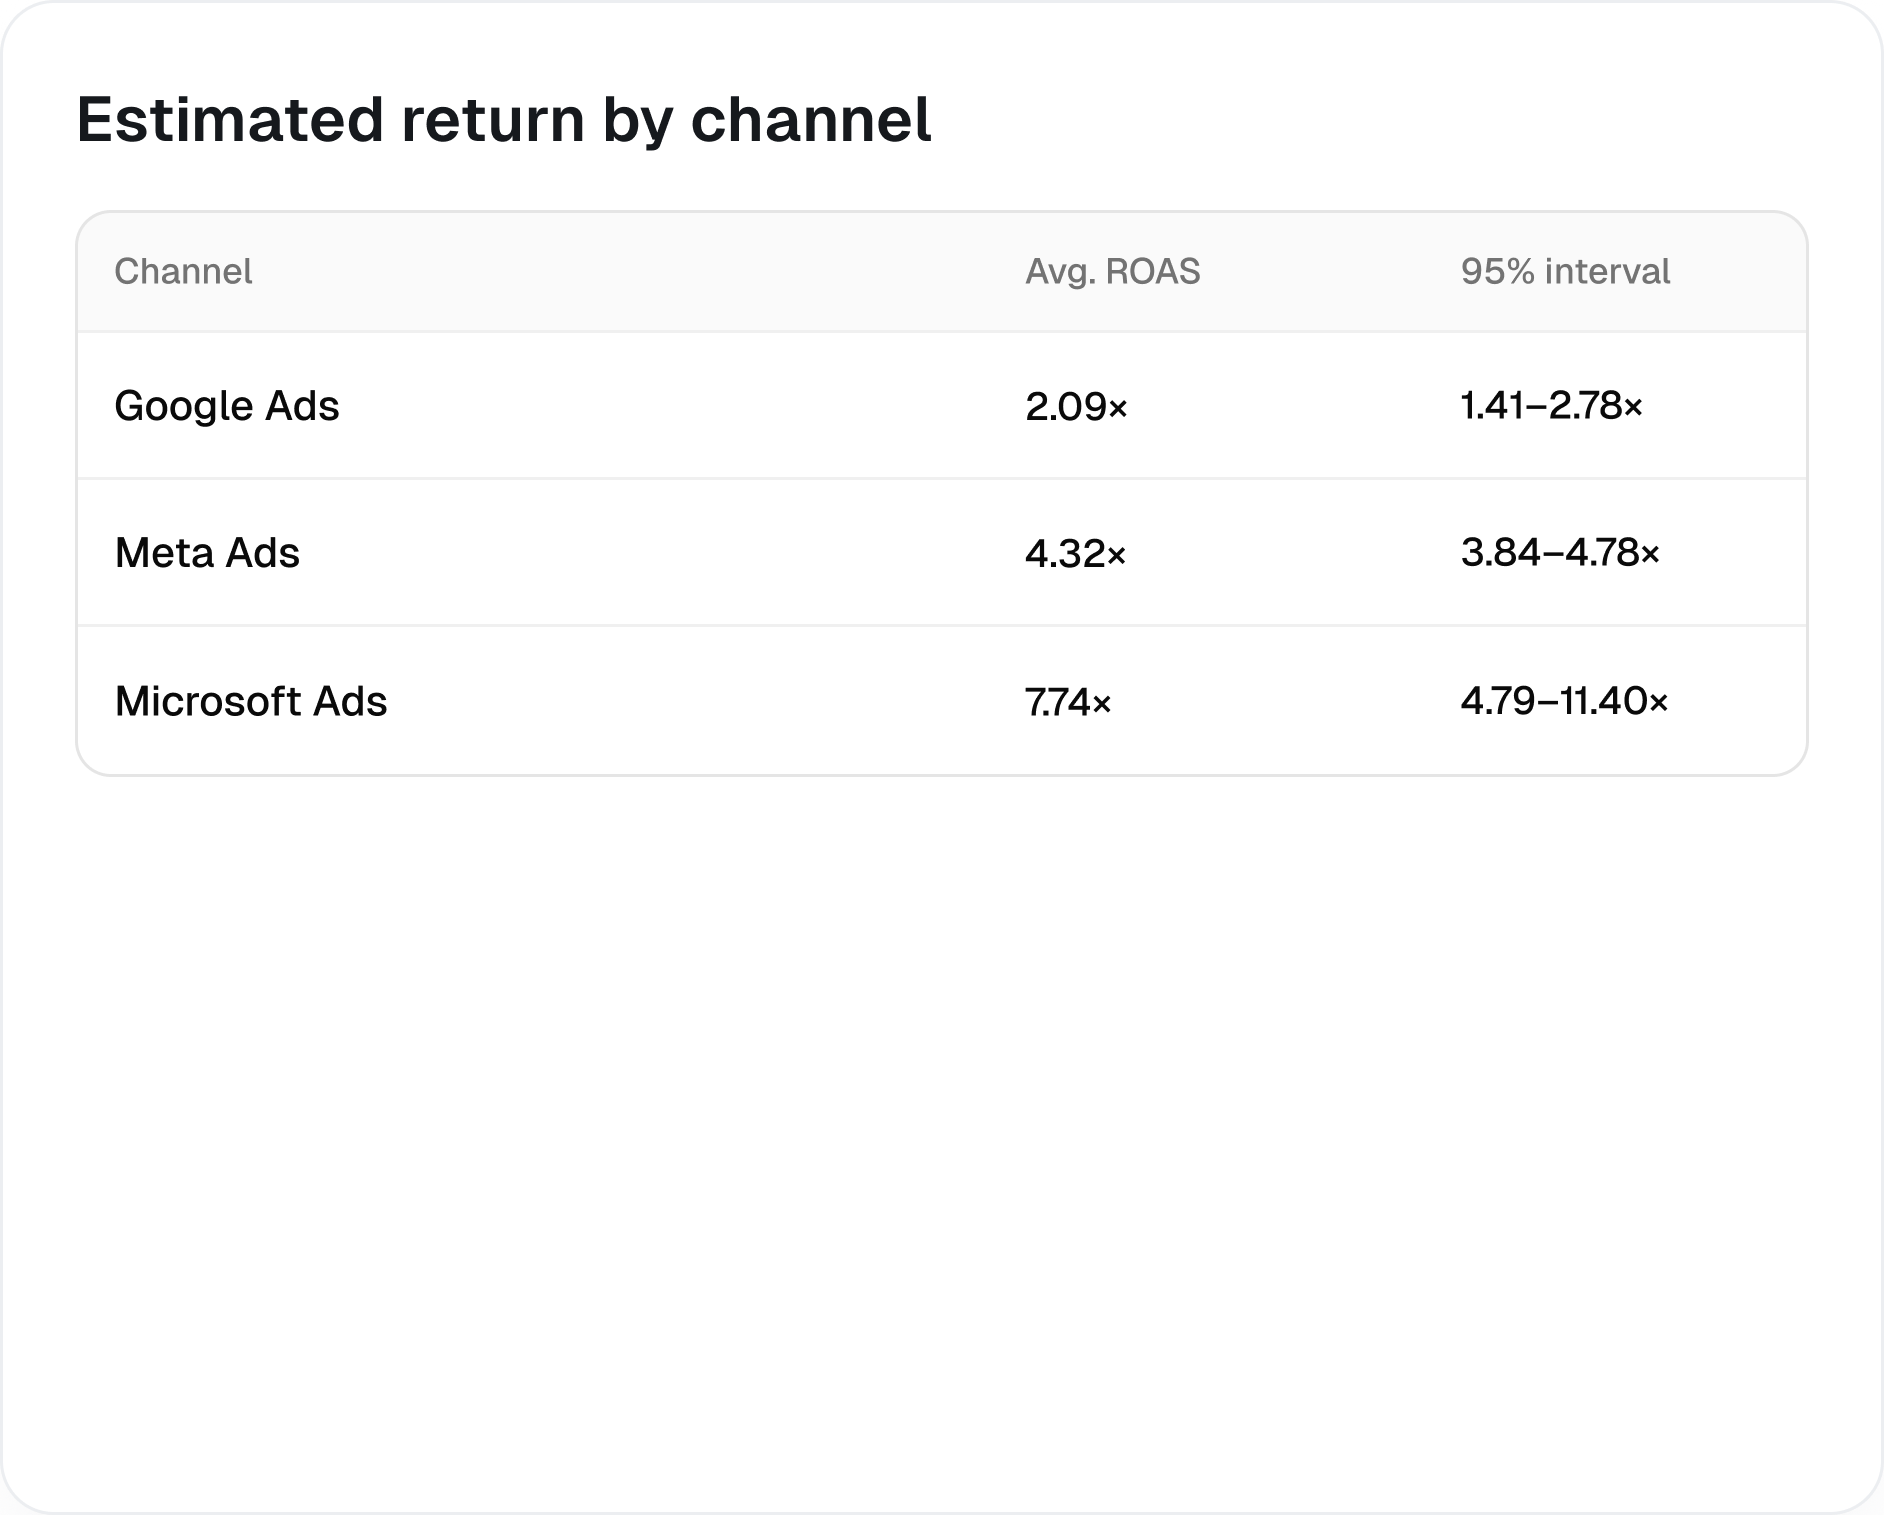
See each channel’s estimated contribution to business results, alongside baseline demand.
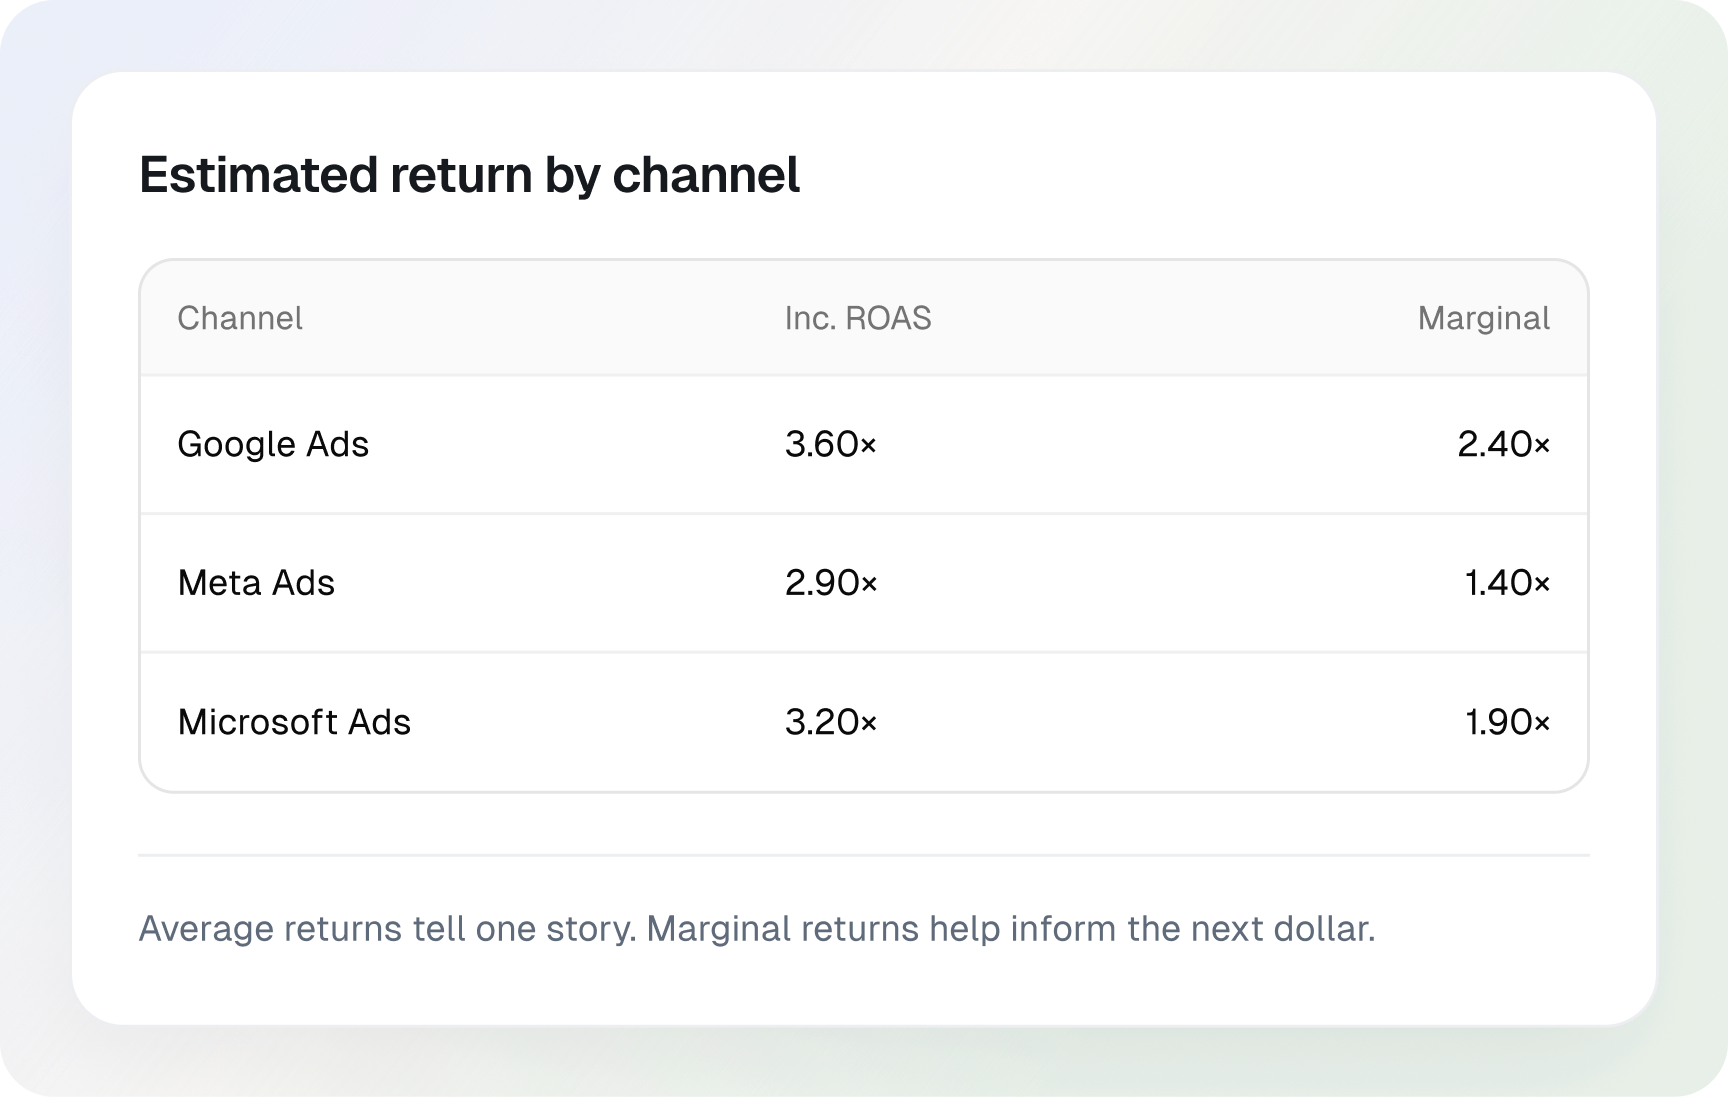
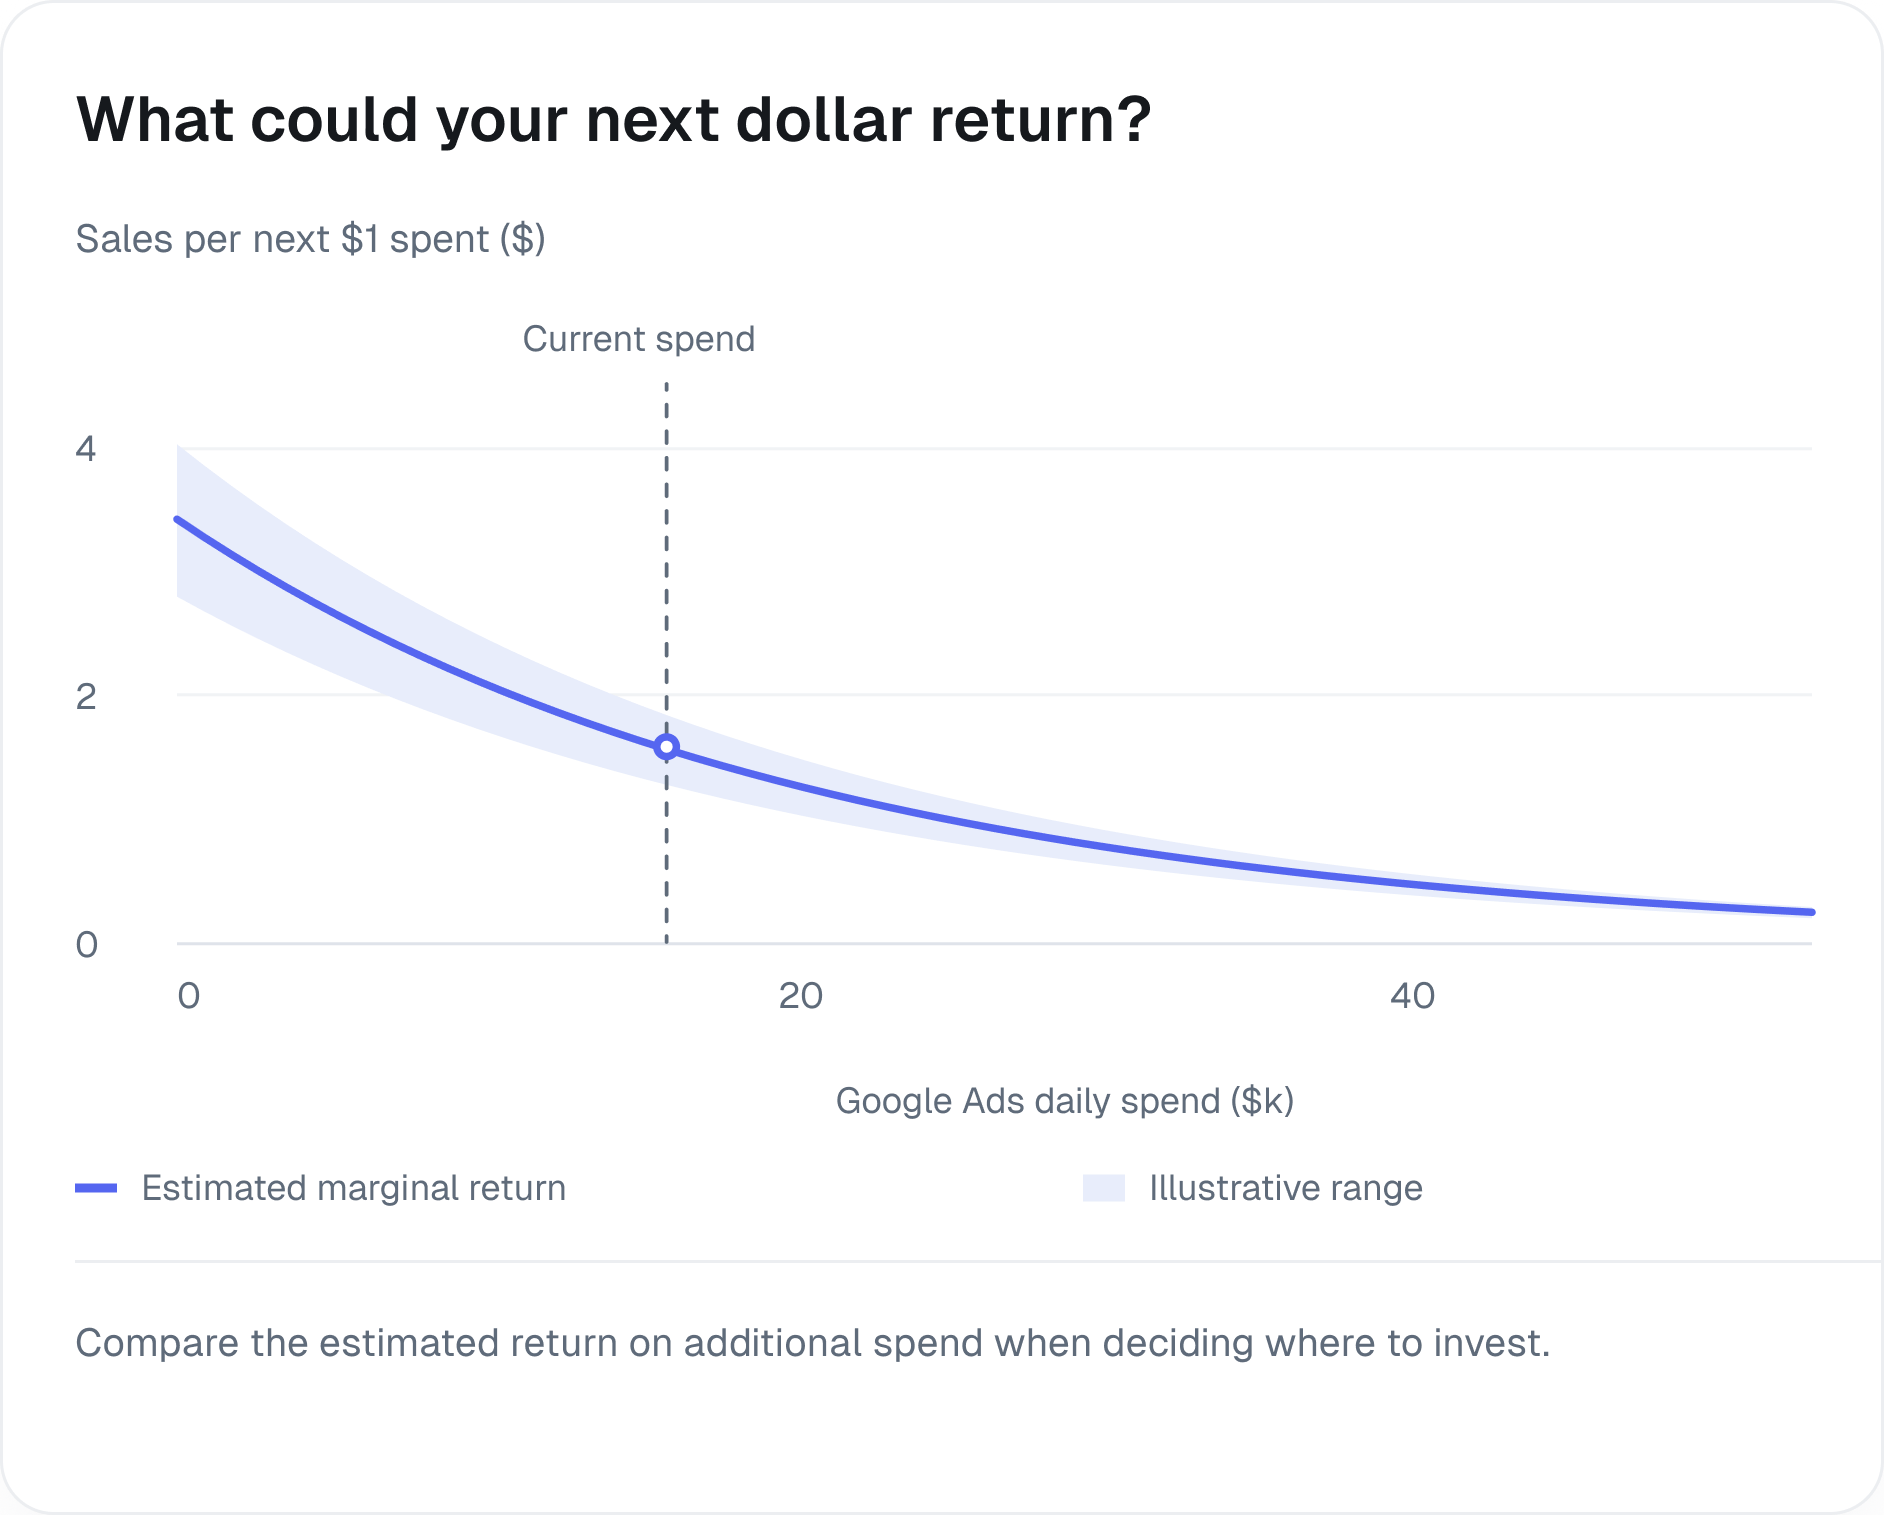
Compare incremental and marginal ROAS, with uncertainty visible alongside the estimates.
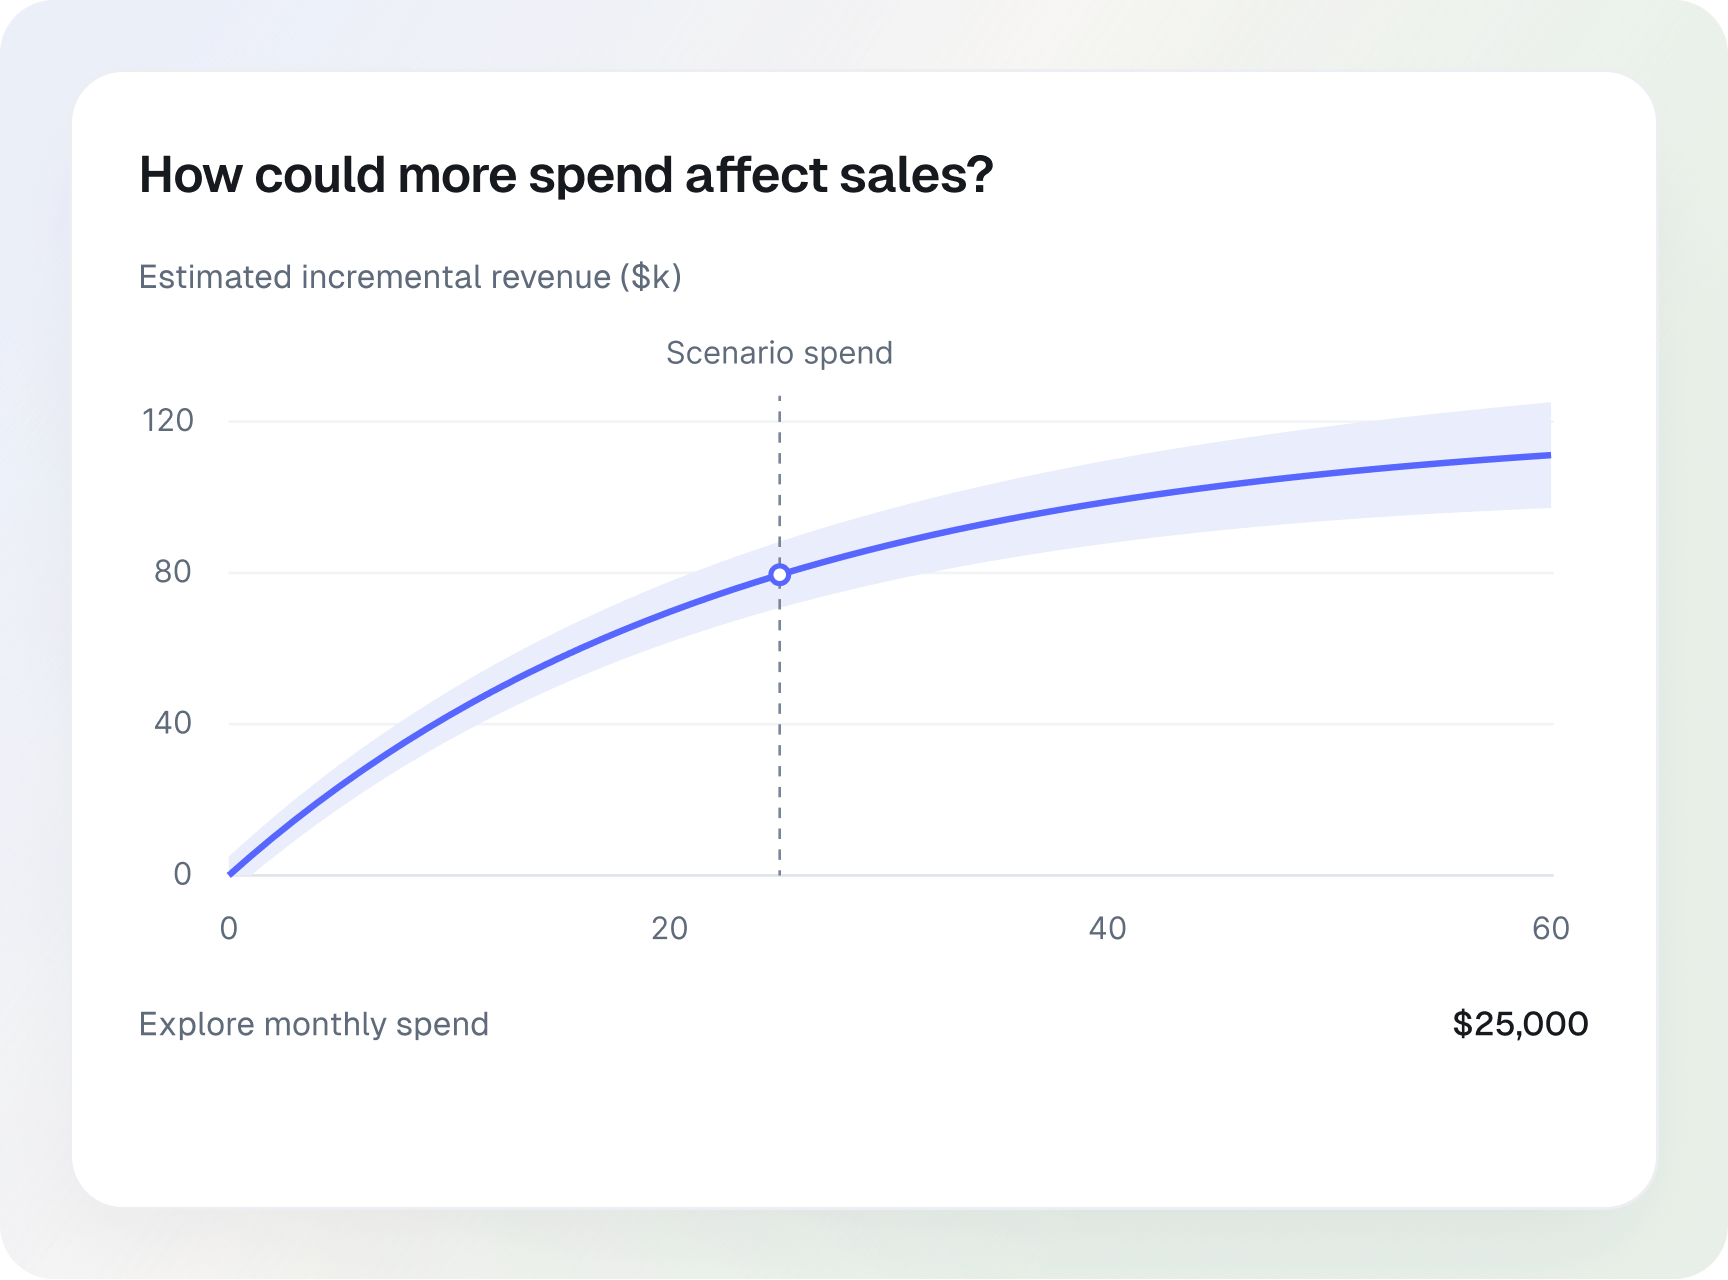
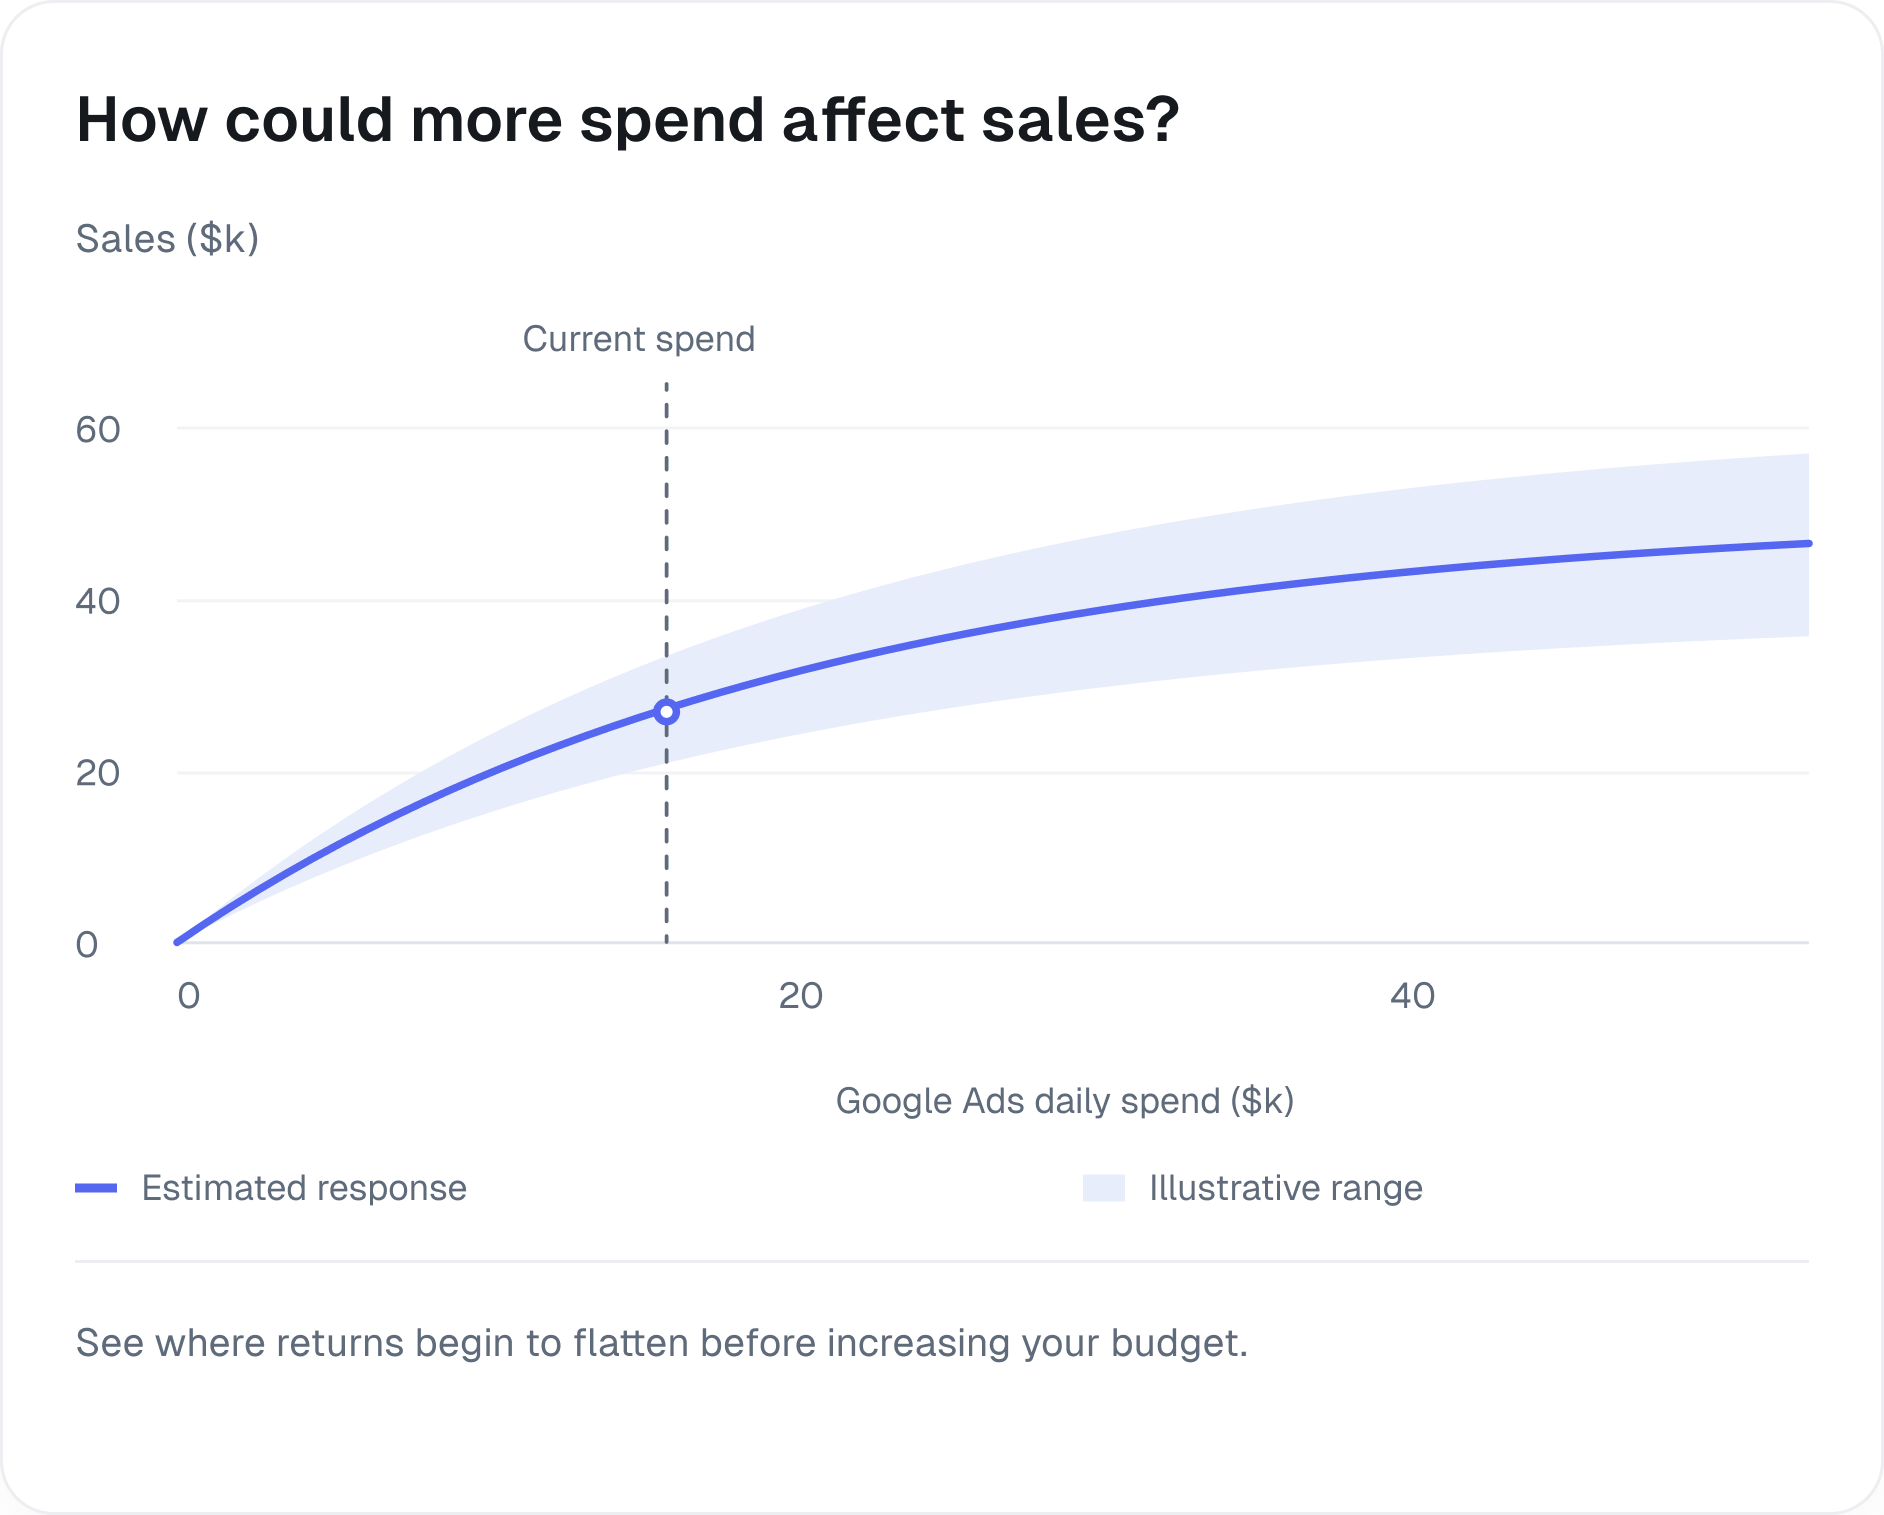
Explore where channels may have headroom and where additional spend starts to deliver diminishing returns.
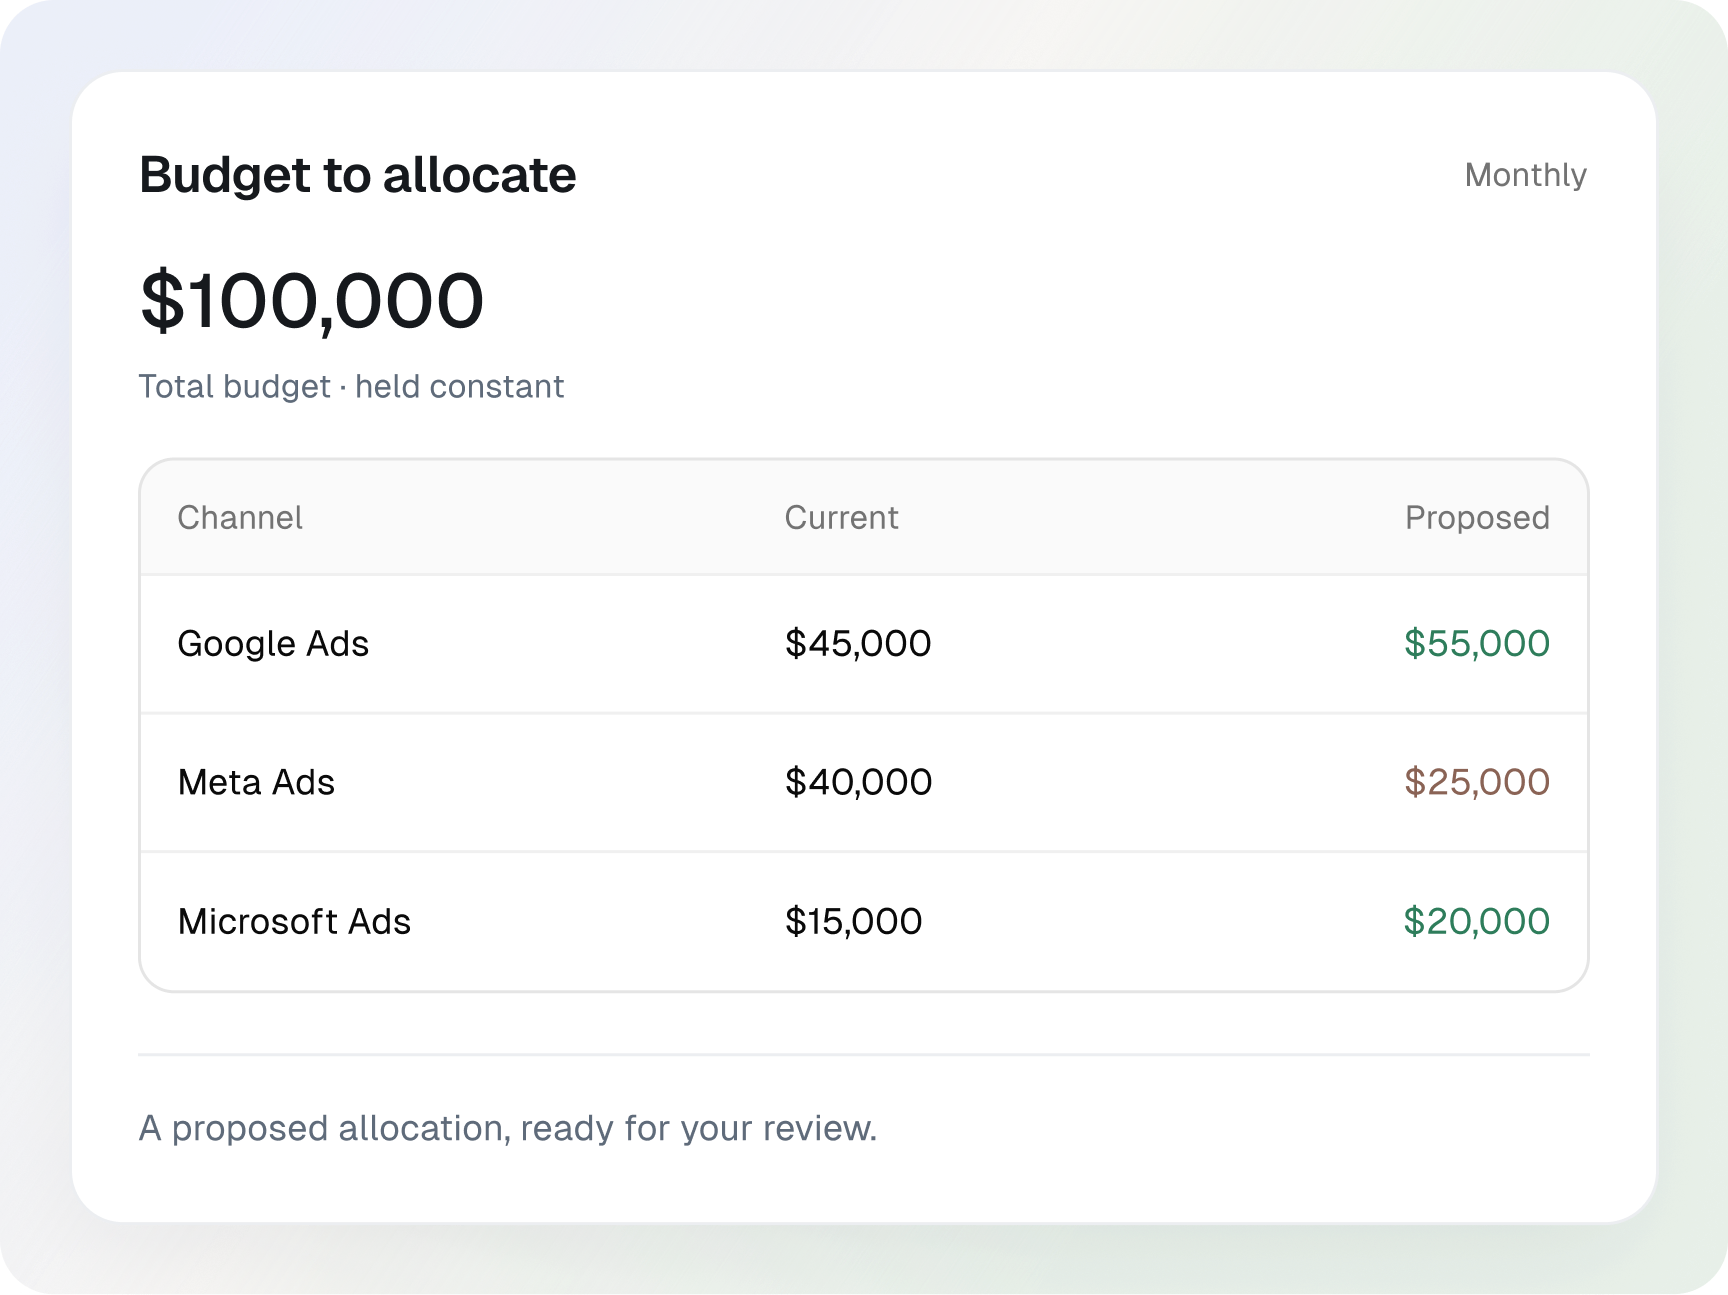
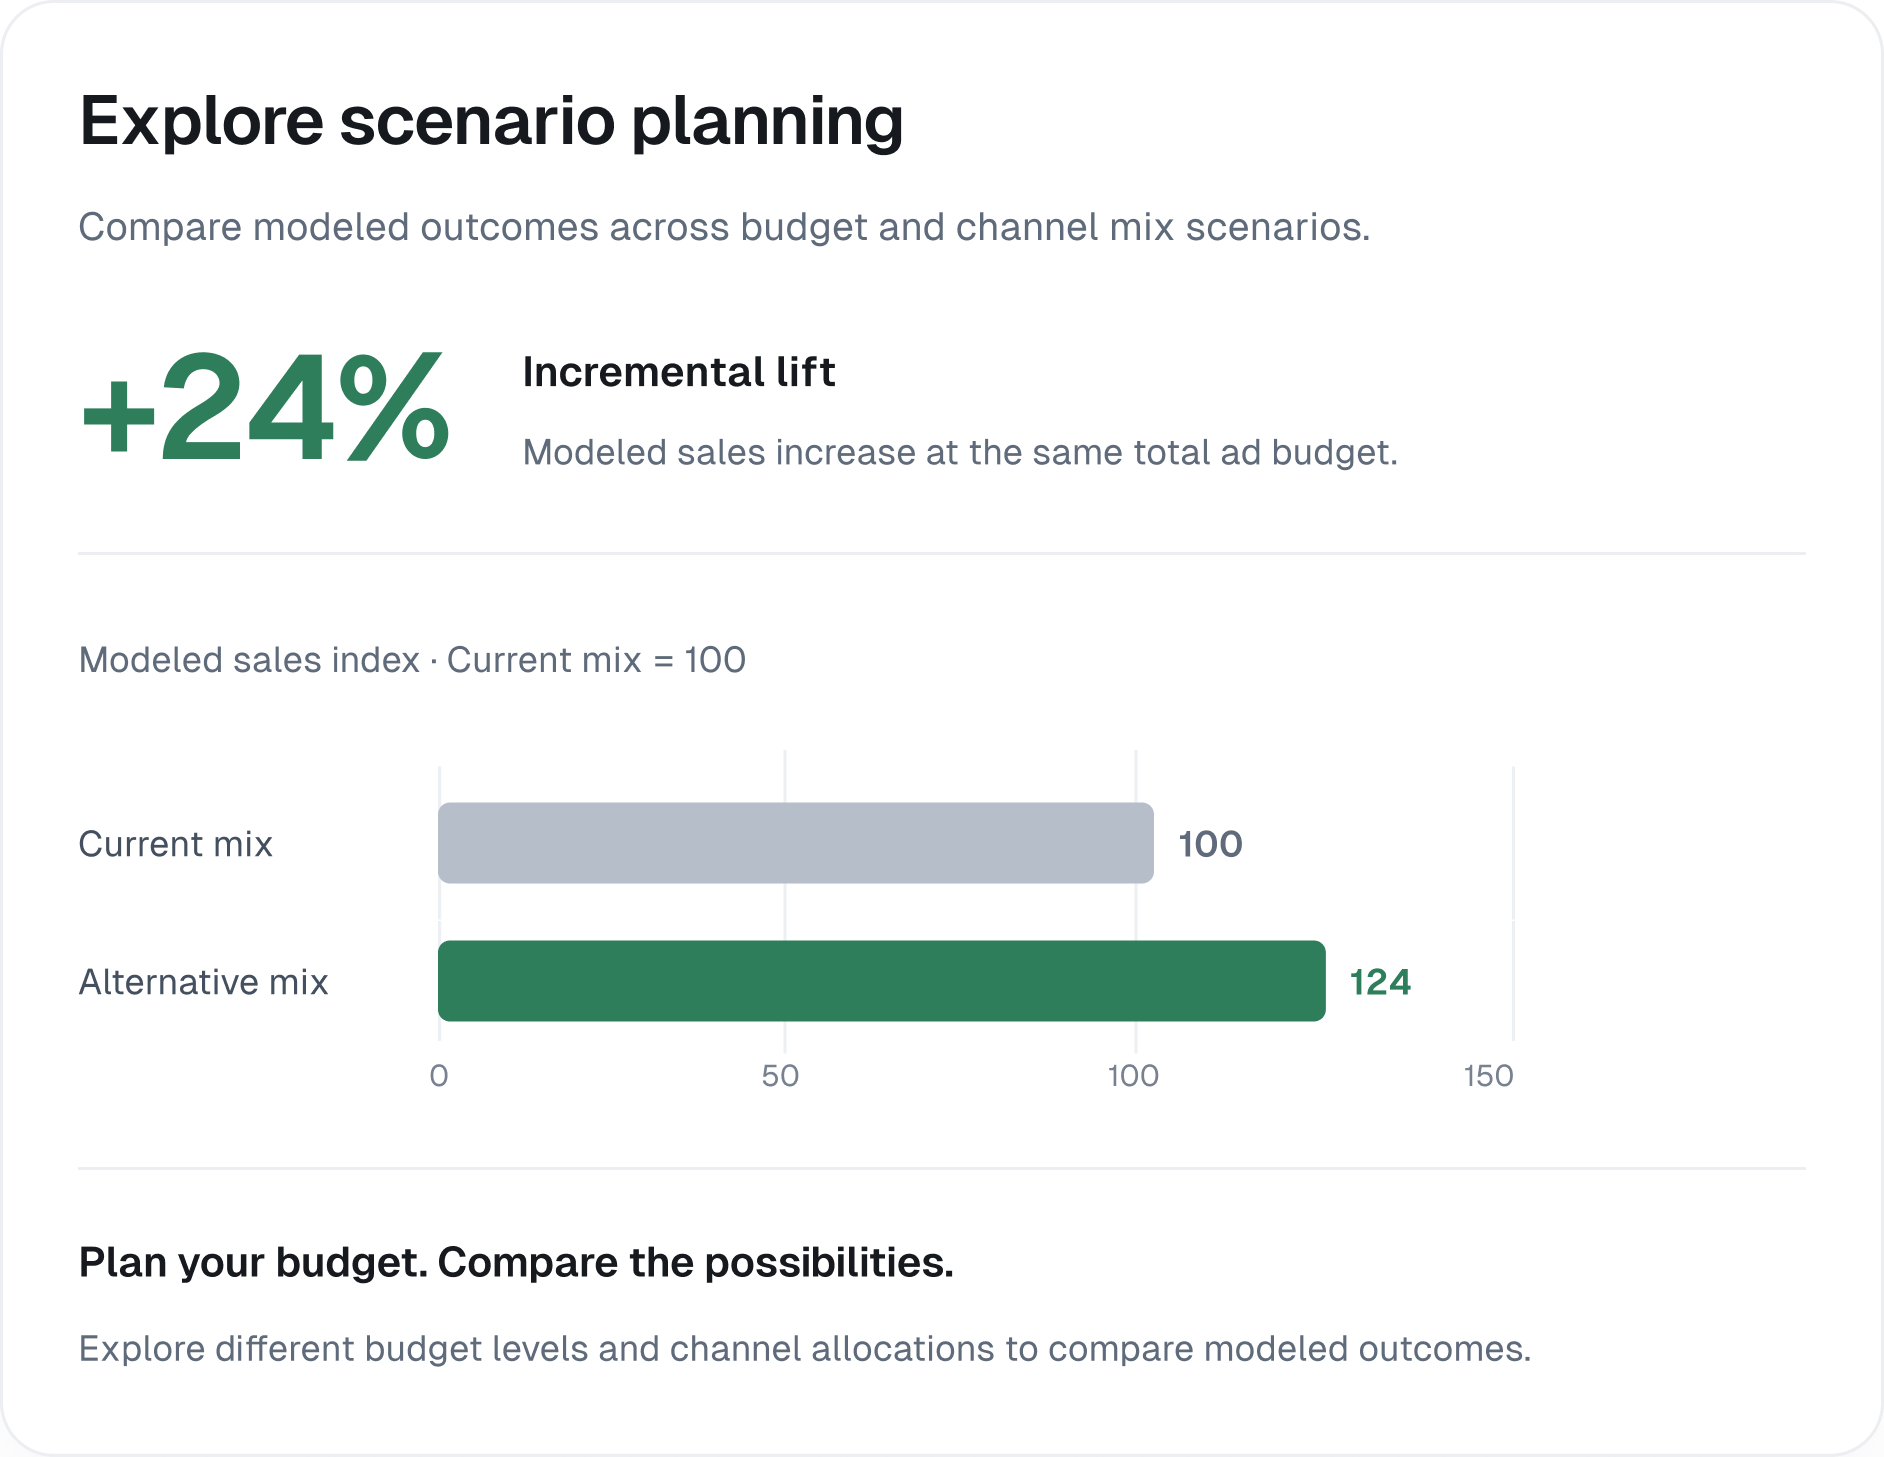
Review your current allocation against a proposed plan, including the assumptions and uncertainty.
All charts use illustrative data. Estimates are not guaranteed outcomes.
Get this analysis for my businessChannel contribution explains the modeled past. Spend response helps explore what could happen next.
Does a channel’s past contribution mean the next dollar will return the same?
Not necessarily. Compare modeled contribution with the spend-response curve and marginal return estimates. Keep uncertainty and diminishing returns in view when considering a new mix.
Synthetic model shares, not customer results or a forecast. Data/model readiness checks apply; advanced budget planning requires enabled access.
Bring your sales and ad-spend history together to estimate channel contribution and explore a better budget mix.
Connect your sales and advertising sources. We’ll assess your history and help identify what’s ready for modeling and what needs more data.
Preview MMM Insights
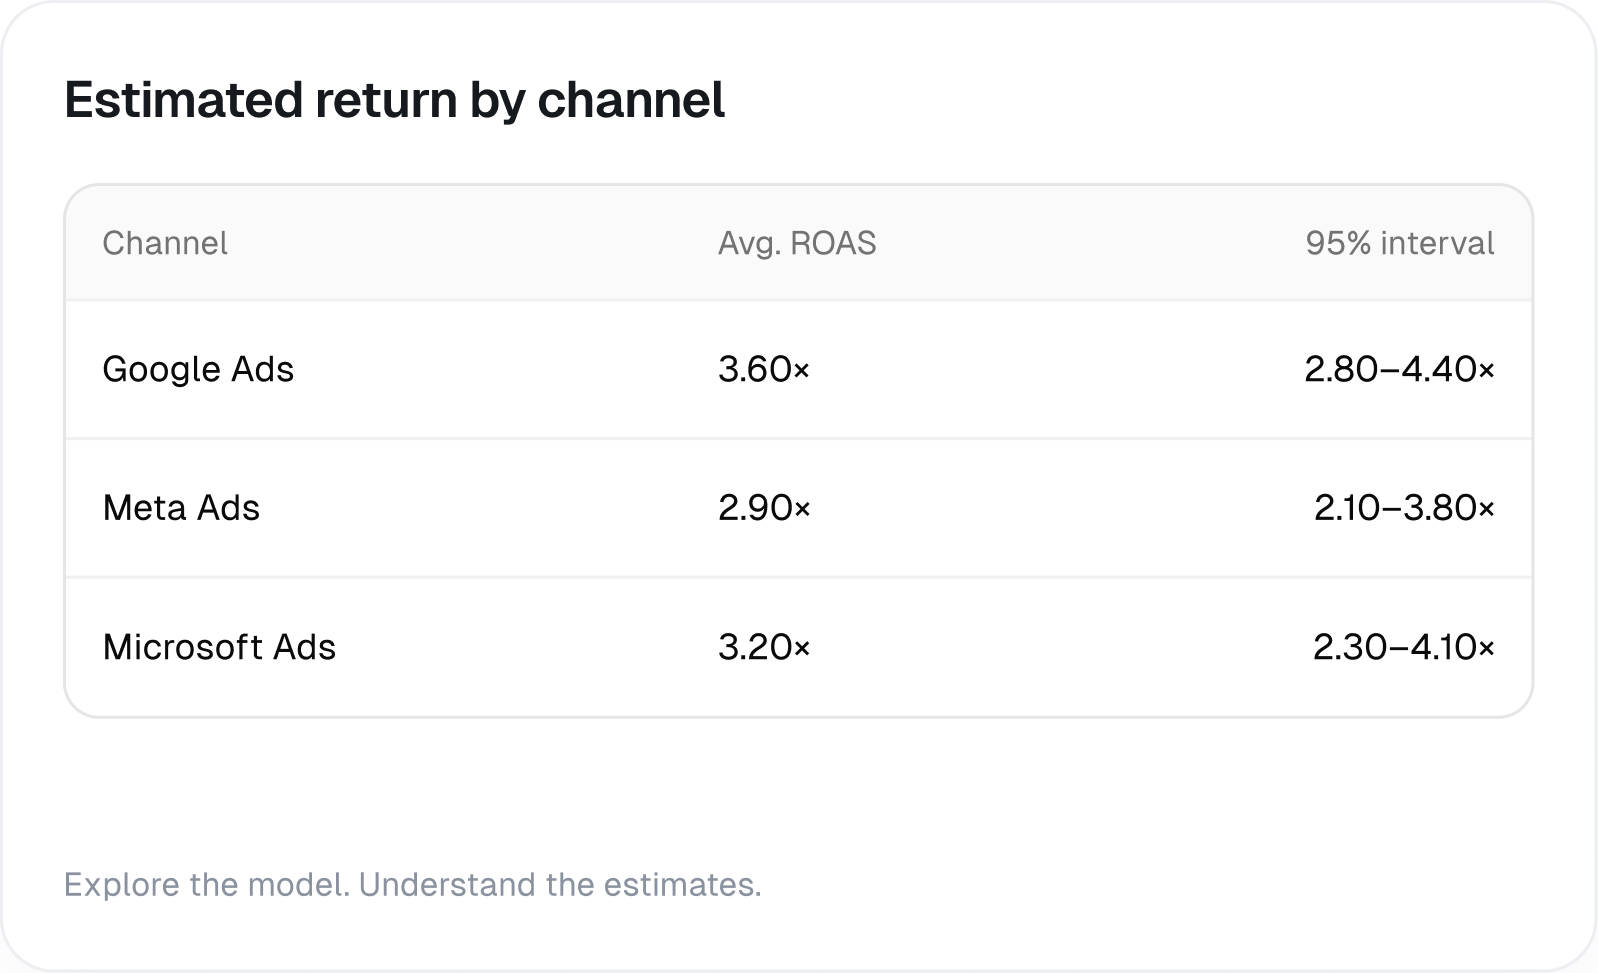 Channel ROAS
Connect supported sales and advertising sources.
MAI evaluates data coverage and quality, then builds and checks your model.
Explore channel performance, return estimates, and budget scenarios.
Not sure your data is ready? Start with your available sales and ad-spend history. MAI checks coverage and quality before modeling.
MAI combines self-serve marketing mix modeling with agent-powered optimization. Start by understanding channel performance, then use MAIOS to move from measurement to approved action.
Start with your sales and ad-spend history. MAI can evaluate usable sales history from Shopify or GA4 alongside supported ad-channel data. Readiness depends on the history, coverage, and quality available for your business.
Connect your supported sales and advertising sources, such as Shopify or GA4 and Google Ads, Meta Ads, or Microsoft Ads. MAI evaluates the available history before modeling; you don’t need to assess data readiness on your own.
Report preparation starts after your data passes the coverage and quality checks. Timing depends on your data readiness and the model checks.
Start by connecting your available sources. MAI checks whether there is enough usable information to build a model and highlights gaps and next steps. A report depends on passing the data and model checks.
Your first measurement report is free. Ongoing modeling is available through a paid plan; review the current plan details during signup.
Understand your results. Explore your next move.
Start with
your first MAI Measurement report.

MAI is a Performance Marketing Agent. Media buying across Google, Meta, and more. Handled.
Try for free
 Connect Google Ads
 Connect Meta Ads
 Connect Shopify