
Where Should the Next Dollar Go? A Smarter Way to Think About Budget Allocation
Measure what your spend drives, compare the return on the next dollar, and validate the decision with incrementality experiments.
One channel is spending $16,000 a day and the numbers look healthy. But that doesn’t tell you whether the next $2,000 should go there, somewhere else, or stay unspent.
Average ROAS tells you how the dollars already spent performed. The budget decision depends on what the next dollar is expected to return. A channel can have healthy blended ROAS even when additional spend is already becoming unattractive.
Average ROAS is not a budget-allocation rule
Last-click and platform-reported attribution answer a useful bookkeeping question: who gets credit for the conversion? That still does not tell you where the next dollar should go.
- Attribution assigns credit; it does not establish what caused the sale. A customer who would have bought anyway can still be credited to the last ad they touched.
- It reports an average while the budget decision happens at the margin. A good blended return can hide weak incremental spend.
- It does not model saturation. As spend rises, audiences tire, auction prices climb, and each additional dollar usually produces less value.
For allocation, you need the shape of the relationship between spend and business value—not one performance point.
The decision curve: spend in, value out
Marketing Mix Modeling (MMM) estimates the contribution of each channel to a business outcome while accounting for factors outside advertising, including seasonality, macro trends, and organic demand. For budgeting, the useful output is a response curve: how estimated business value changes as spend changes.
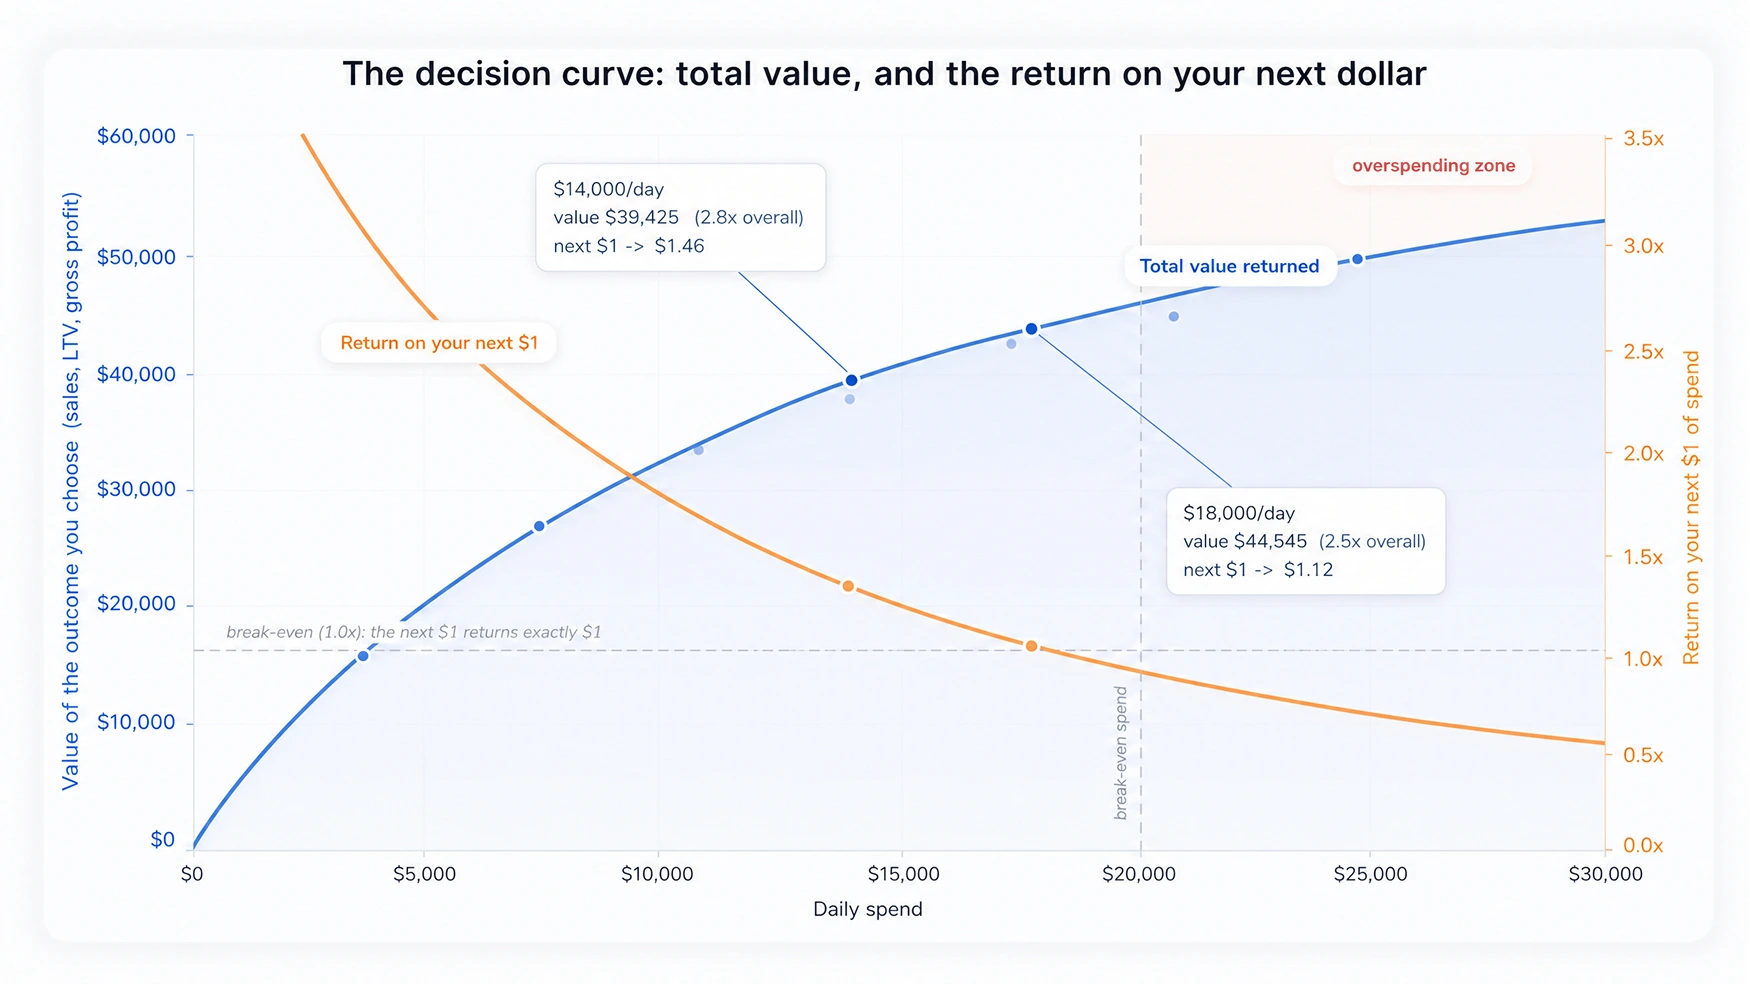
A useful decision curve gives the team three different numbers:
- Average efficiency: the return on the dollars already spent, using a measure such as ROAS, LTV/CAC, or return on gross profit.
- Marginal return: the expected return on the next dollar. This is the budgeting number.
- Break-even point: the spend range where estimated marginal return falls below the business threshold.
A disciplined model also shows uncertainty. When the historical evidence is thin, the confidence range should widen. That is a reason to test before making a large move, not a reason to pretend the estimate is more precise than it is. In Figure 1, that uncertainty sits alongside the gap between average and marginal return.
In the example, $18,000 of daily spend is associated with about $45,000 of value: roughly 2.5× on the average dollar and about $1.10 on the next dollar, each with a realistic range around it.
Optimize for the outcome the business actually values
Revenue is not always the goal. Leadership may care more about new-customer growth, gross profit, subscriptions, or predicted LTV. The allocation model should use one consistent business objective across channels so the recommendation reflects what the company is actually trying to maximize.
That objective also needs a threshold: break-even ROAS, a target LTV/CAC, a gross-profit requirement, or another agreed efficiency guardrail. Without one, the curve describes performance but does not tell the team when to scale or stop.
How to allocate the next dollar
Whether the decision is about one channel or a fixed budget across several, the operating logic is straightforward:
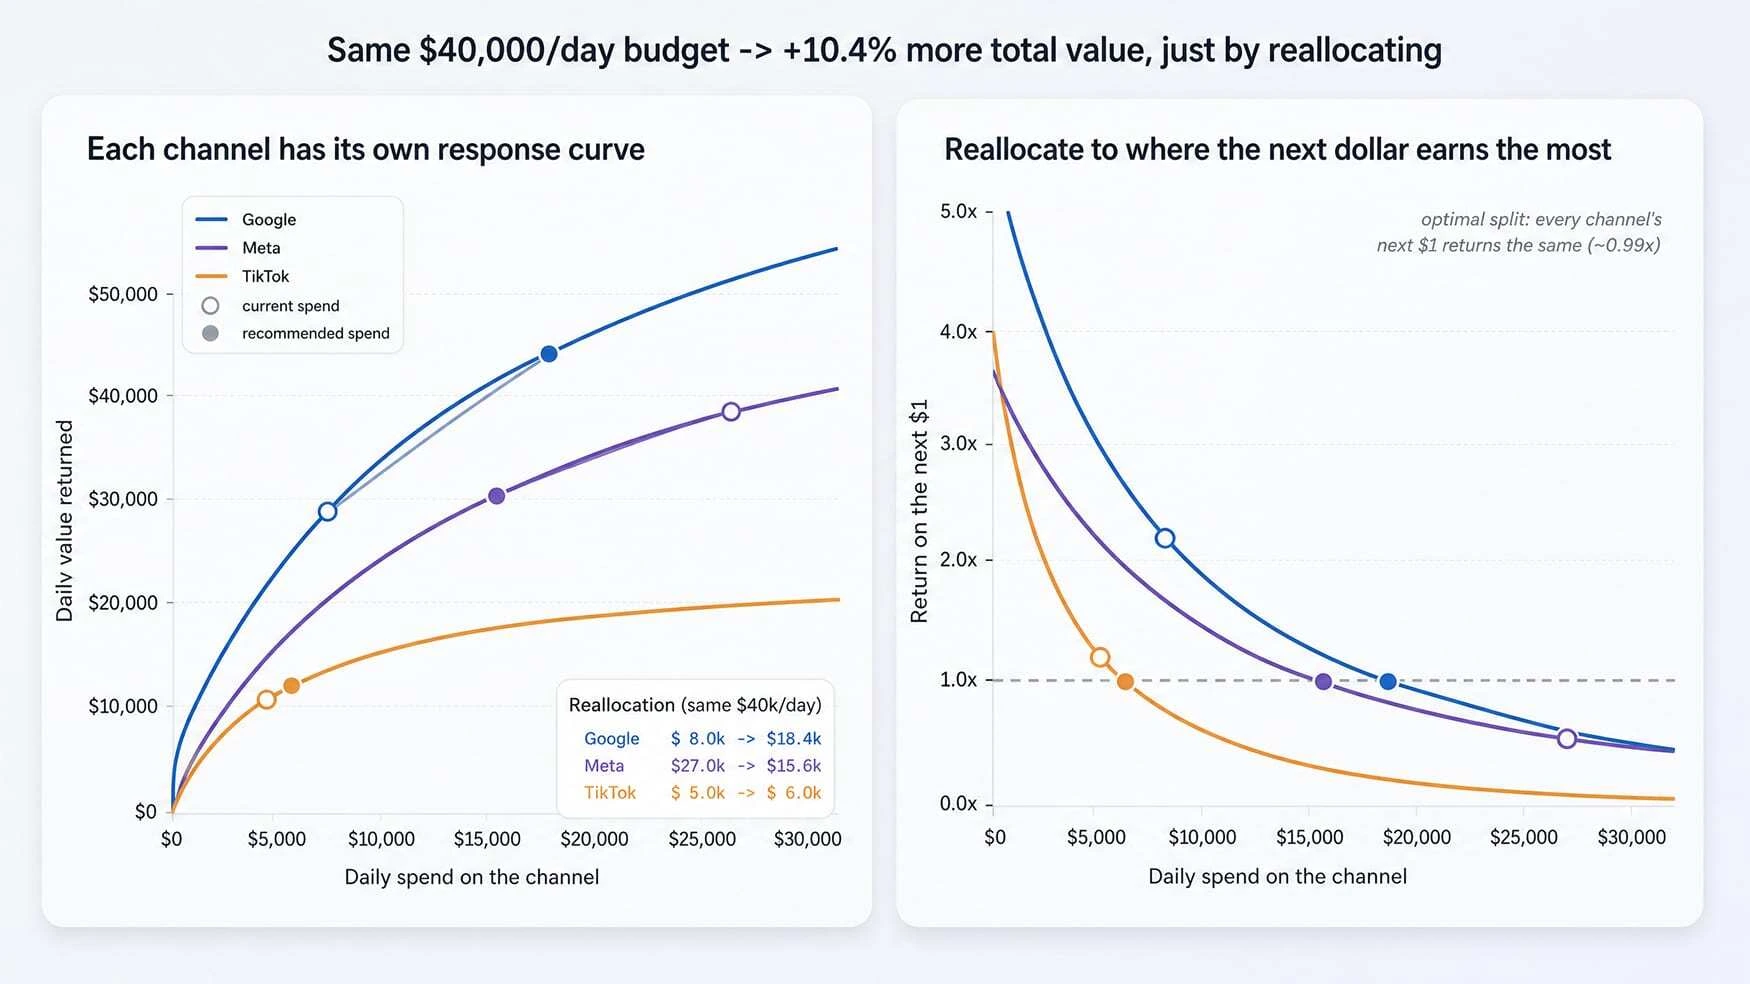
- Compare estimated marginal return across channels.
- Move the next dollar toward the strongest remaining opportunity.
- Keep going until marginal returns converge or a channel reaches the business threshold.
- Estimate the impact of adding or removing budget before the money moves.
Suppose Channel A is expected to return $1.45 on its next dollar and Channel B $1.05. You move budget from B to A. As A scales, its marginal return falls. Reallocation continues until the two channels settle at a similar marginal return or a constraint stops the move.
Figure 2 shows what the reallocation is trying to achieve: a recommended daily budget or bid target by channel, followed by re-measurement as performance and the curves change.
From a quarterly study to an operating loop
Traditional MMM is often delivered as a standalone project. The team gets a point-in-time view of historical performance, makes a set of budget decisions, and comes back to the same questions at the next planning cycle.
MAI combines measurement, budget recommendations, campaign optimization, and incrementality testing in the same operating workflow. That makes it possible to use model output as an input to ongoing decisions rather than treating MMM as a report that sits beside execution.
The operating loop is:
- Measure channel contribution and uncertainty.
- Recommend the next budget move against the chosen business outcome and guardrails.
- Apply approved changes through the optimization workflow and continue tuning.
- Validate with incrementality testing and use the result to calibrate future recommendations.

Regular MMM and MAI’s MMM
| Differentiation | Regular MMM | MAI’s MMM |
|---|---|---|
| Decision making | Standalone study with point-in-time recommendations | Measurement and recommendations connected to an ongoing media-buying workflow |
| Models | Traditional regression, often focused on historical contribution | MMM with adstock, saturation, seasonality, promotions, and uncertainty estimation |
| Validation | Often benchmarked through directional consistency | Incrementality testing and model calibration can be used to validate important decisions |
| Execution & optimization | Static report requiring manual interpretation and implementation | Recommendations can flow into MAI’s optimization workflow, with human-defined objectives and controls |
The one-paragraph version for your CFO
Attribution helps explain who received credit. For budget allocation, the useful signal is marginal return. MAI brings measurement, budget recommendations, execution, and incrementality testing into one operating workflow so the team can make allocation decisions against the business outcome and efficiency guardrails that matter.
Make the next budget decision with the right signal
A budget meeting should not end with a debate over which dashboard looks most convincing. What matters is which move is likely to create the most incremental value, and how confident you are in the estimate.
That makes measurement useful for the decision, not just the report.
See where your next dollar should go
See how MAI can turn measurement into budget recommendations and ongoing optimization around the business outcome and guardrails your team sets.
Similar articles
Measurement for AI Decision Systems
- Measurement
- Attribution
- AI Agents
Traditional attribution answers who got credit for past spend. Decision systems need a measurement layer that answers what to do next. Why the gap matters, and how MAI bridges it.
Incrementality Testing in Practice: From Investment Case to Proof
- Incrementality Testing
- Geo-Lift Testing
- Brand Search
- Media Budget Allocation
- Performance Marketing
See how a conservative Brand Search investment case was validated with A/A and geo-lift incrementality testing before additional budget was funded.